

















Oxford’s average nitrogen dioxide (NO₂) concentrations fell by 10% in 2024 compared with 2023, according to Oxford City Council’s June 2025 Annual Status Report. The report recorded a 50% reduction between 2014 and 2024.
The council nevertheless warned that meeting legal limits does not make air pollution harmless.
What the 2024 monitoring showed
Among 118 NO₂ monitoring locations, Headington Hill recorded 43 µg/m³, above the national annual limit of 40. The council said this monitor was not a site of relevant public exposure for annual-limit assessment. Four monitors exceeded Oxford’s then-local target of 30 µg/m³; only St Clements was a relevant-exposure site.
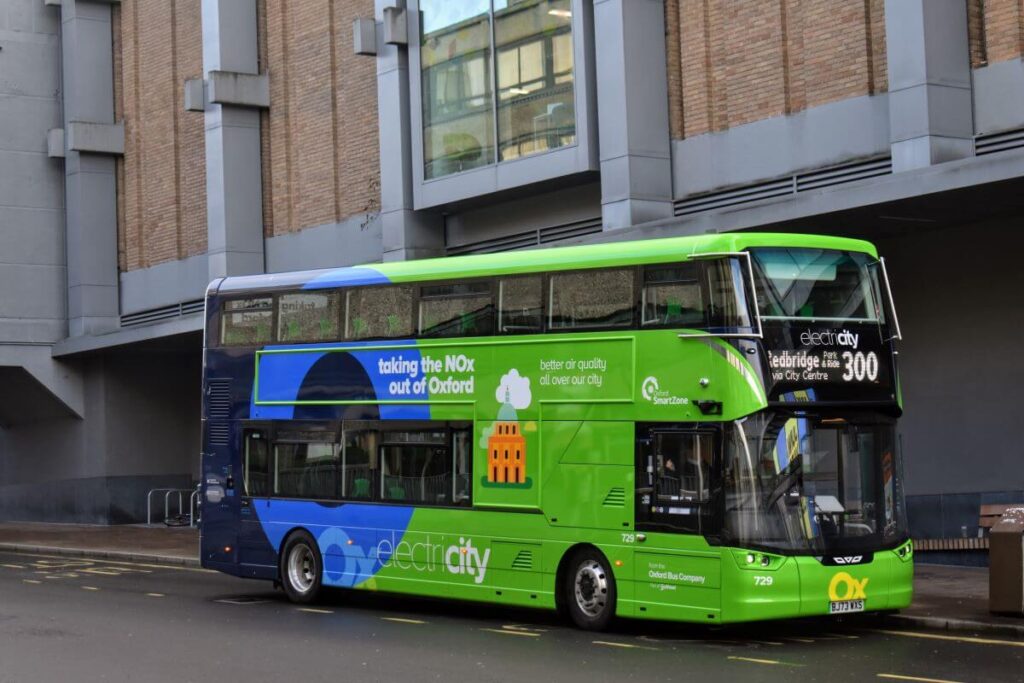
Electric buses and changes on Oxford’s roads
The report linked improvements on busy bus routes to 159 electric buses introduced in 2024. It recorded falling NO₂ at monitored LTN locations and boundaries, and improvements on bus-served streets within the Zero Emission Zone.
Across four Botley Road monitors, average NO₂ fell from 19 µg/m³ in 2022 to 14 in 2024, spanning the road closure.
These are observations across a period of several changes. They do not, by themselves, establish how much of each reduction was caused by an individual traffic scheme.
The council’s 2026–2030 action plan puts buses’ share of Oxford’s road-transport NOx emissions at 4% in its 2025 comparison, against 32% in 2019. That is a share of emissions from road vehicles, not all emissions across the city, and it is different from the NO₂ concentrations measured in the air.
Legal limits, future targets and WHO guidelines
The World Health Organization’s air-quality guidelines are health-based recommendations. They should not be presented as a boundary below which pollution is guaranteed to be safe.
The table replaces an infographic that incorrectly labelled 10 µg/m³ as the current UK PM2.5 legal limit. All values below are annual averages, measured in micrograms per cubic metre (µg/m³).
| Pollutant | Current national legal limit applicable in England | WHO 2021 guideline |
|---|---|---|
| PM2.5 | 20 µg/m³ | 5 µg/m³ |
| PM10 | 40 µg/m³ | 15 µg/m³ |
| Nitrogen dioxide (NO₂) | 40 µg/m³ | 10 µg/m³ |
Defra distinguishes the existing PM2.5 limit from England’s legally binding target of 10 µg/m³ by 2040. Oxford’s local NO₂ target was 30 µg/m³ by 2025; its new target is 20 µg/m³ by 2030. Those local targets are separate from the national limit and WHO guideline.
What has changed since the original report?
In its 15 July 2026 update, the council reported that every site of relevant public exposure was below the local 30 µg/m³ NO₂ target in 2025. The citywide average fell from 18 µg/m³ in 2024 to 17 in 2025, while St Clements fell from 34 to 28.
Oxford adopted its Air Quality Action Plan for 2026–2030 in February 2026. It is therefore no longer a forthcoming plan awaiting consultation, as the original article described it.
The council’s annual reports provide the detailed monitoring results. For current conditions and forecasts, use Defra’s UK-AIR service; an annual average cannot tell a reader whether pollution is elevated on a particular day.
Correction and update, 16 October 2026: We replaced the misleading particulate-limit infographic, clarified the period used for the long-term NO₂ comparison and the road-transport basis of the bus emissions figures, and removed unsupported causal claims. We also added the subsequent monitoring and action-plan updates.